The number of drilled but uncompleted wells (DUCs) continues to build across the U.S., rising nearly 60% over the past two years. Consequently, this is creating an unprecedented backlog of oil and gas production that could add a new wave of supply.
Why a DUC?
A DUC could be just the vertical part of the horizontal well (to set pilot hole casing). In addition, DUCs can often result from a variety of reasons, such as:
-
Drilling in an unconcentrated fashion to maintain leaseholds
-
Drilling in areas where elements frack or transport infrastructure is outstripped by supply or still developing (including water)
-
Operators waiting for economics (i.e., oil prices and recovery technology) to improve
-
Drilling to prove reserves and maintain borrowing bases
-
Maximizing the use of available capital resources
-
Other operator or field/well specific reasons
DUCs on the Rise
The total number of DUCs in U.S. shale plays reached 8,594 in December 2018, according to the U.S. Energy Information Administration (EIA) and Ralph E. Davis Associates (RED) data), up 218 from a month earlier, with 4,048 of those residing in the Permian Basin (Figure 1).

Figure 1 - Production & DUCs By US Region
(Source: EIA, Ralph E. Davis Associates)
Figure 2 shows historical DUCs by U.S. region relative to total drilled wells and total completed wells in each basin.

Figure 2 - Historical DUCs By US Region
(Source: EIA, Ralph E. Davis Associates)
Market sentiment appears to be mixed on whether oil prices need to continue to recover from levels now around $50 per barrel (/bbl) to spur new production. The boom in production has particularly been pronounced in the Permian region, which housed 484 rigs last week, according to Baker Hughes and RED data (see Figure 3), pumping over 3.8 MMbbl of oil and nearly 13 MMcf of natural gas daily last month.
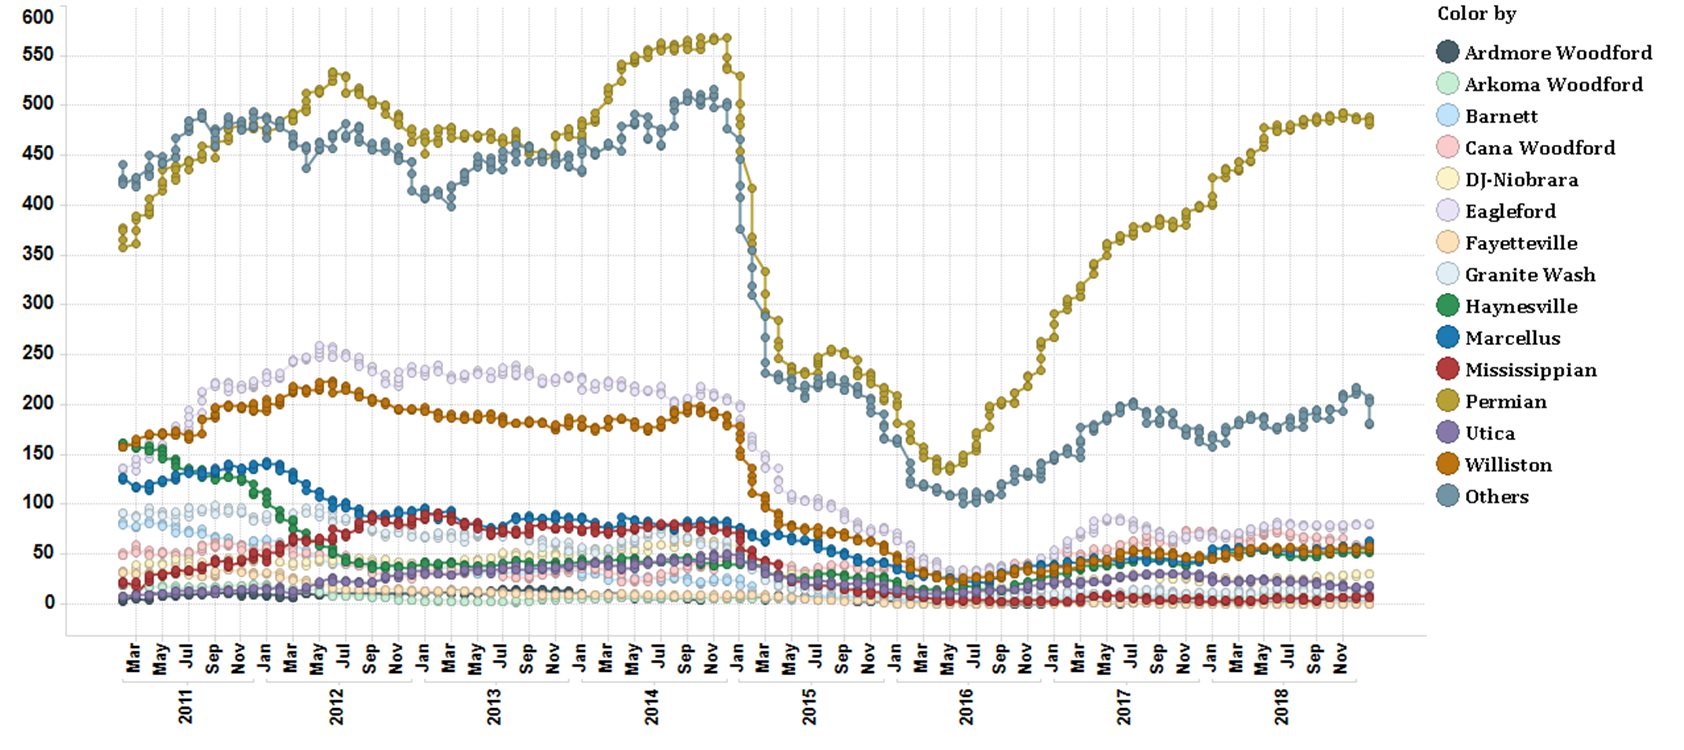
Figure 3 - Total US Rig Count By US Region
(Source: Baker Hughes North America Rotary Rig Count, Ralph E. Davis Associates)
Pipeline Takeaway Relief For DUCs On The Way?
Operators in the Permian mostly suffered decreasing efficiencies for much of last year, as restricted pipeline takeaway capacity cut into the production each rig yielded. Additionally, the continued increase in the DUC count in the basin has decreased per-rig efficiencies.
A handful of new pipelines being developed by midstream companies is expected to add more than 2 MMbbl/d of new pipeline capacity in the second half of 2019, after which more DUCs could be completed. Below are a few planned projects with their expected takeaway capacities and completion dates:
|
Pipeline (Developer) |
Capacity (bbl/d) |
Completion |
|
Cactus II (Plains All American) |
670,000 |
Q3 2019 |
|
EPIC (EPIC Midstream) |
550,000 |
Q3 2019 |
|
Gray Oak (Phillips 66/Andeavor) |
700,000 |
Q3 2019 |
|
Midland to Nederland (ETP) |
600,000 |
2020 |
(Source: Information from company websites)
Despite a $25 slide of the WTI oil price since early October, oil and gas producers are showing no signs of reducing drilling programs in the short term. If WTI remains near the current level of $50/bbl, however, then this could stall future growth.
