[authors: Heidi Aragon and Daniel Schreiber]
Hail the size of golf balls, softballs, and even grapefruit has always made weather news. Each spring and early summer, local weather stations and people across the United States share photos and videos on social media of hail, along with measurements, comparisons, and the damages sustained to their property. So, how has hail news become a hot topic in the insurance industry, specifically as it relates to solar farms? The following information may be of particular interest to insurance industry personnel, solar developers, risk managers, and owners and operators of solar facilities in the United States or with interests in the United States.
Impacts of Hail on Solar Farms
As the United States continues the transition to renewable energy to meet national climate goals, land that was previously not desirable or considered remote and undeveloped has been purchased or leased to install solar farms. Coincidentally, some of these undeveloped areas lie within historically severe weather across the United States but may not have historical hail data available due to their remote nature. Now that solar farms are being constructed or are operating in these largely remote areas, some of the largest renewable energy losses sustained in the United States are being reported as a result of hail. In 2019, the now infamous Midway Solar hail claim made insurance industry headlines with losses totaling approximately $70-80 million in west Texas because of hail more than two inches in size. Each year since, the insurance industry has continued to see reports of hail claims totaling $5 million to $80 million on solar farms and claims seem to be occurring with greater frequency. In 2022, the renewable energy insurance industry experienced recording breaking losses upward of $300-400 million related to hail damages. One likely contributor to the growth in frequency of hail claims year over year is the increased development of solar facilities in historically hail prone locations where hail was previously underreported.
Hail Damage in the Solar Industry
To better understand how and why the solar industry has seen, and will continue to see, large hail losses, this article will discuss:
- Weather Analysis and Prediction of Hail
- Some of the manufacturing requirements for solar modules that address hail.
- Research and development in the solar industry to combat hail.
- Microfractures, and testing for the same.
- Best practices after a hail event.
Weather Analysis & Prediction of Hail
The National Weather Service classifies hail as “severe” when it reaches one inch (25 mm) in diameter. Before the year 2010, “severe” hail was characterized once it reached 0.75-inches (19 mm) in diameter. An added classification of hail is “significant severe,” at two inches (50 mm), and “giant” at four inches (100 mm) in diameter. The NOAA Storm Events Database contains a collection of these reported hail events across the United States.
Despite the growing trend of reporting hail events and subsequent documentation in official weather archives, there are many significant limitations, including:
- Hail measurement (or estimation) errors.
- Reporting and documenting policies.
- Insufficient sample sizes.
- Geographical differences.
J.S. Held previously published an article about the many limitations of weather reports here.
One of the most notable issues surrounding historical hailstorm documentation in the official archives is the overall lack of sufficient reporting of severe weather in rural areas. Why? Simply because of a sparse population and lack of buildings and infrastructure that would incur damage because of the weather. In other words, “If no one was there to see big hail, and it didn’t damage anything because nothing was there, did it really happen?” Yes. However, this information will not be found in the reported hail event archives (Cecil 2009; Blair et al., 2017). Therefore, assessing weather risk should be done by identifying long-term trends in atmospheric potential for severe weather (Figure 1) instead of strictly by historically observed weather, which is often biased toward highly populated urban areas.
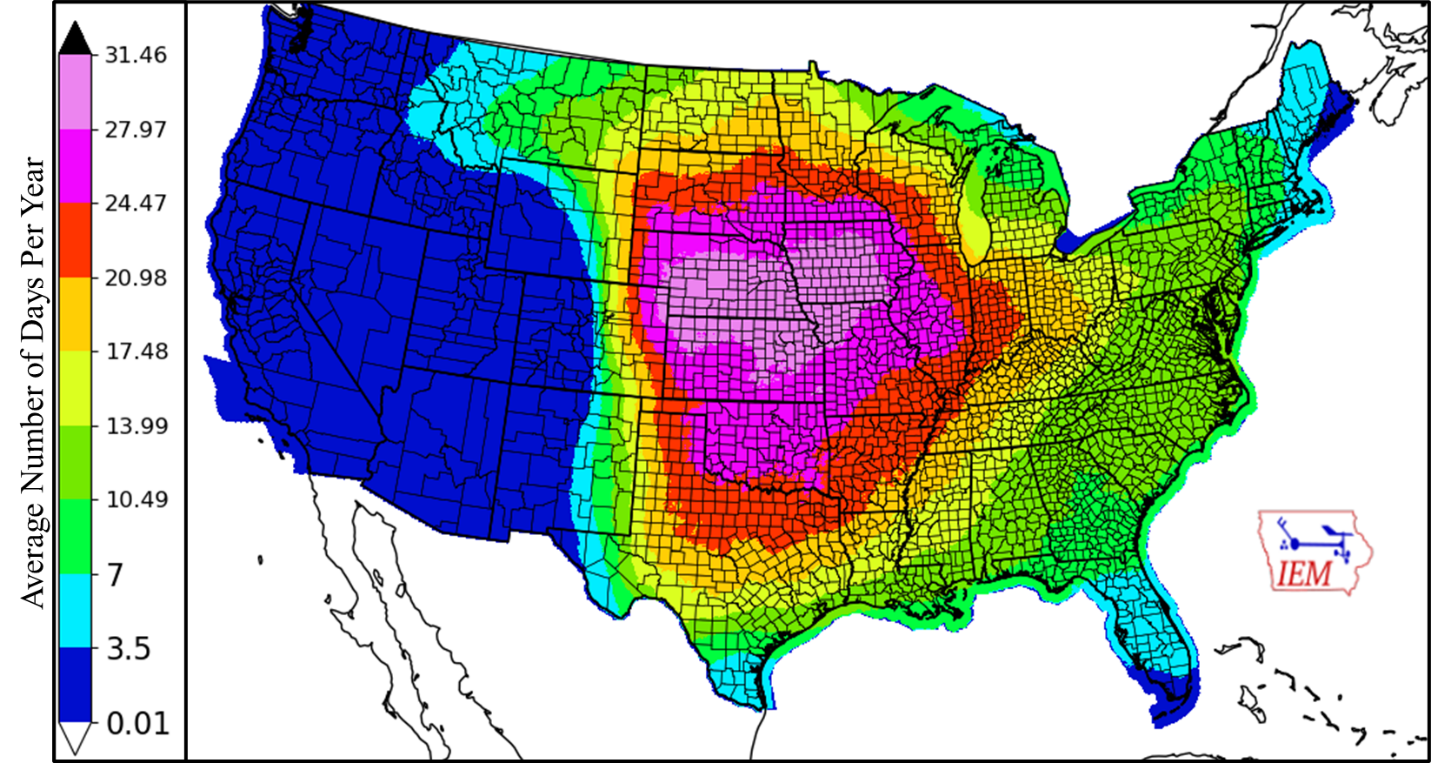
Figure 1: Frequency of severe hail risk (15% or higher chance of at least one-inch hail) between the years 2002-2023 (Source: NOAA; Iowa State University).
It is common for solar farms to be built in rural, undeveloped areas, such as the Midway solar complex mentioned above. In these rural areas (and even suburban areas), risk analysts should understand that there is likely an under-sampling of historical weather events within official weather archives.
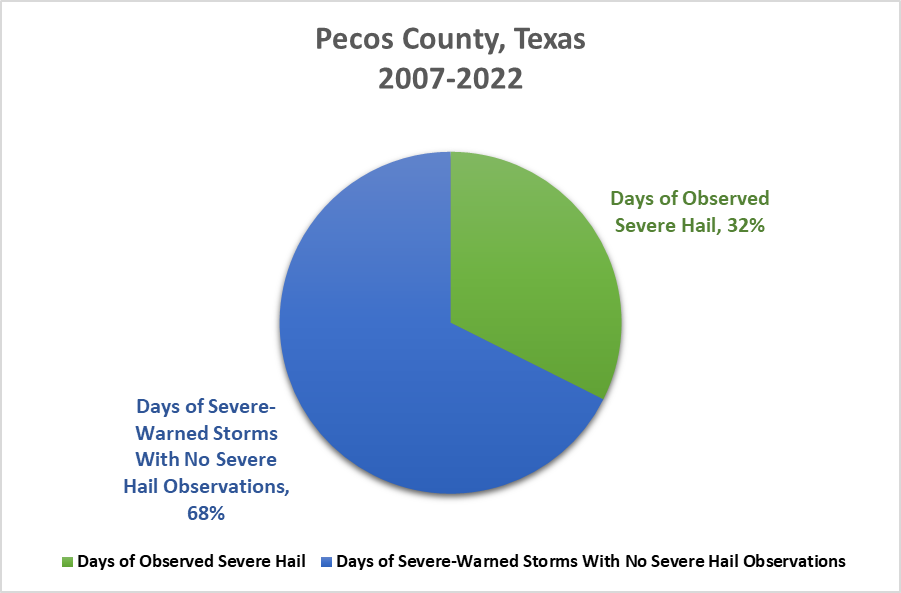
Figure 2: Days of severe weather warnings versus days of severe weather observations in Pecos County.
For example, Pecos County, Texas, is a rural county with a population density of about 3.2 people per square mile (2020 Census). It is also home to many large solar farms. According to NOAA data stored in the Iowa State University database, between the years 2007 and 2022, Pecos County recorded an average annual observed severe hail count of 6.4 days per year but experienced an annual average of 20 days under severe thunderstorm warnings. During this period, only 32% of the days during which severe weather warnings were issued had corresponding reports of large hailfall somewhere in Pecos County (Figure 2).
The atmosphere over west Texas (including Pecos County) is very conducive to large hail production during storm season, therefore an overwhelming majority of warnings for severe thunderstorms contain a threat for hail. Hence, a reasonable statistic to draw from this information is that only about one in every three severe events in Pecos County during this period is recorded in official hail observation archives.
Additionally, there was no significant long-term trend (increase or decrease) of reported hail events or warnings for severe thunderstorms during this time, indicating that severe weather is nothing new to this area. Rather, the hail events and severe weather in general are significantly underreported and, therefore, are significantly unaccounted for in historical databases. In this case, it is likely that in Pecos County, the hail risk is two to three times higher than one would assume when only reviewing reports of hail, without considering the probability of meteorological conditions that promote hail risk, which requires a highly skilled meteorology professional.
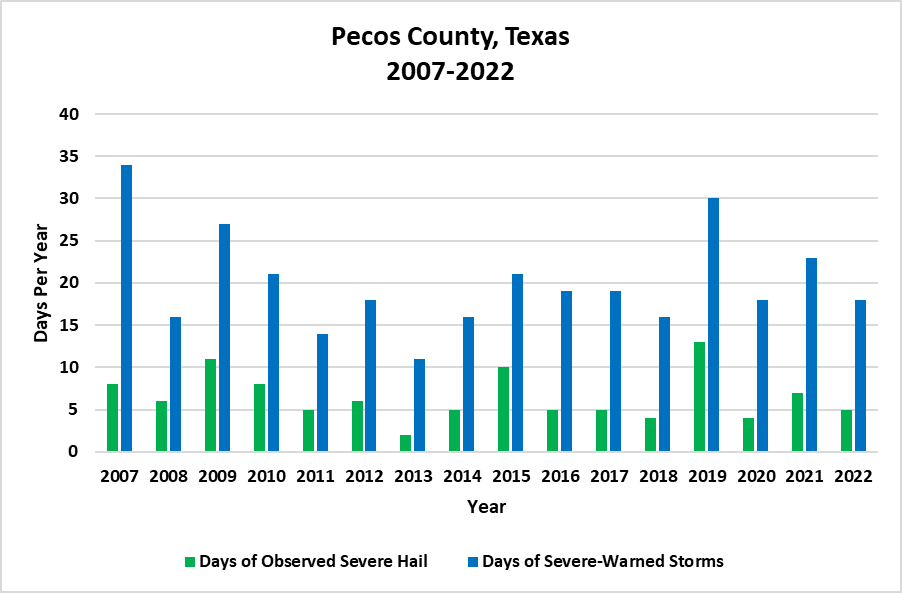
Figure 3: Days of severe weather warnings versus days of severe weather observations in Pecos County, by year.
We also understand that wind-driven hail can result in impact energy and direction that differs from hailfall absent of wind, as well as differences in hail shapes and densities (Dieling et al. 2020), leading to significant limitations and uncertainties regarding laboratory hail tests. While certain stow angles may perform better overall in a textbook hailfall episode—similar to what would be experienced under laboratory conditions—the chaotic nature of many hailstorms makes it difficult to predict the angle and direction of hailfall, the associated winds, drag coefficients, densities, and velocity of falling hailstones in real-time. It should be noted that certain stow angles for hail may not be preferential for a coexistent severe-caliber wind event—an extreme example being a proper hail stow that then compromises the solar modules during a coexistent downburst wind event. In this case, understanding the risk of individual storm events as they pertain to the solar array’s actual position in real-time is most advantageous and would certainly require the employment of a meteorologist.
Ultimately, obtaining a weather review by a meteorologist is the best approach to properly identifying risk due to a wide range of severe weather events at solar farms before they are even built and/or insured. Furthermore, the monitoring of real-time severe weather events by a skilled meteorologist is recommended, as this will allow companies to maximize energy generation while also providing advanced notice of individual severe weather threats affecting their exact location(s).
Solar Module Manufacturing Requirements
While considering the potential for hail during development and construction phases, the capital expenditure on modules for a new solar project makes them a key component of hail resilience at a site. There are four main types of solar modules available in the United States markets today:
- Monocrystalline.
- Polycrystalline.
- Passivated Emitter and Rear Cell or Passivated Emitter and Rear Contact (PERC).
- Thin film.
While these types of modules each have pros and cons, the modules share one thing in common: they all must meet the IEC/UL 61730 safety requirements during manufacturing. This standard has undergone some revisions since its original publication in 2004; however, the most recent requirement states that as of December 4, 2019, all solar modules installed in the United States must comply with the newest updates to UL 61730 (UL1703 / UL 61730 – PV Module Safety Standards Updates: Making the Transition, 2018). One of the criteria needed for PV modules to achieve a UL mark is passing a hail test where an ice ball is shot at least 10 times without the module glass breaking; however, the module manufacturer can specify a desired diameter of the simulated hail used in the test, and UL verifies compliance with the selected parameters (see Figure 4 below). Solar modules are typically reported to be tested on the lower end (25mm or ~one inch) as opposed to the higher end (75mm or ~2.95 inches) as 25mm is the minimum passing requirement to achieve a UL mark. There are companies who offer testing beyond the minimum requirements, but this comes at an additional expense.
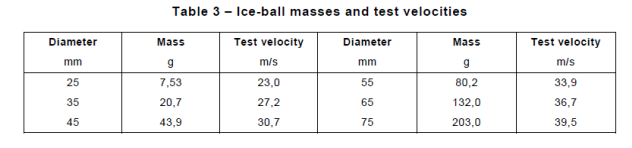
Figure 4: UL PV Hail Testing Requirements (Colleen O'Brien, UL, 2019).
In addition, it is up to the designer of the specific solar farm to perform a site-specific risk assessment in relation to the solar modules selected for construction and determine the risk of exceeding test conditions, including the size of hail, at the specific site.
The trend in the solar industry is to continue developing modules with thinner glass, which, in turn, decreases the weight of the module and impacts the design specifications of the overall system. Heavier modules require a more robust (ergo, a more costly) system to support them.
In short, manufacturers are only required to meet the minimum UL standard, and it is their choice to manufacture a module that exceeds the minimum. Exceeding the minimum requirement has cost implications throughout the supply chain from manufacturing to installation, potentially prohibiting large scale production or adoption.
Hail Risk Research & Developments
Along with manufacturing requirements, additional research and development has occurred to address the ongoing hail risk including:
- Manufacturer warranties against microfracture or power loss due to hail less than 25mm/~one inch.
- Extended hail testing from third party vendors on the selected modules for hail greater than 25mm/~one inch.
- Software development for single axis tracking systems (SAT) that allows for modules to be stowed at 50-, 60-, or even 75-degree angles, thereby reducing the impact angle of the hail stones.
Manufacturers have long since published their degradation rates on the module specification sheets for the life of the module. However, in recent years, module manufacturers have started to respond to the industry’s concerns and have warranted their modules against power loss from microfractures.
Recently, the authors of this publication had an opportunity to discuss module testing with Cherif Kedir, President & CEO of RETC, LLC, a third-party independent testing company offering dozens of module tests, including hail impact tests and the hail durability test (HDT). RETC publishes a yearly PV module index report where they rank the quality, performance, and reliability of modules in a series of tests they offer, including the hail durability test. The purpose of the hail durability test is to “assess the characteristics of the PV modules and their [materials] and constructions when subjected to installations in hail-prone regions” (RETC, LLC, 2023). When discussing the results of their hail durability program, Cherif reiterated that in RETC’s experience of testing modules, the construction and treatment of the module has the most impact on the hail durability testing results—specifically, how much tempering the module glass received during manufacturing, the thickness of the module glass, and the angle of the hail impact on the module.
While understanding the hail durability of the selected module is important, the installation and/or stow angle of a module during a hailstorm has a significant impact on the damages sustained. Tracking systems have increased in popularity through the years, although it wasn’t until around the end of 2019 that software was developed and implemented by several tracking system companies to address a hail stow option.
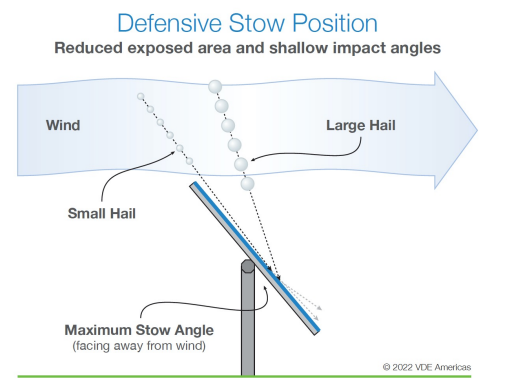
Figure 5: Example of defensive hail stow position (Source: VDE Americas).
The hail stow option moves the modules into a 50- to 75-degree stow angle, which increases the angle of impact incidence, thereby reducing the amount of impact energy of the hail stones and reducing the amount of damage sustained. In the last three years of working large hail claims, our renewable energy team has seen the results of effective hail stow in cases where two to three-inch hail fell. On sites with no hail stow capability or activation available, damage appeared to be more widespread, and there was a larger transition range from severe damage to no damage. On sites where hail stow was activated, the transition between severe damage and no damage was much closer together, and the steep stow angle appears to have minimized damages.
Solar Module Microfractures
Even with the most advanced technology in place and operating, a site may experience a catastrophic hail event. The first question is always how much of the site is damaged. While the question is often about what can be seen with the naked eye, invariably the question is asked about microfractures. Along with the research and developments to mitigate damages related to hail, one of the common discussion topics surrounding hail damage to modules is microfractures: how they occur, how to identify them, what is considered hail related damage, and what is the potential impact of microfractures on future energy output on the module.
Microfractures, or microcracks, are a common occurrence in photovoltaic (solar) modules; they are cracks found in the solar cell ranging in size from inches to as small as micrometers but cannot be seen with the naked eye. They can occur during the manufacturing process, during shipping and handling, during installation, throughout their lifetime due to environmental stressors such as damaging hail, wind and snow, and thermal stress from daily and seasonal temperature changes. Several methods exist to non-invasively inspect solar modules for the presence of microfractures.
Ultraviolet Fluorescence (UVF) is a fast, low-cost inspection method that requires no electrical connection to the module and can provide indications of the potential presence of microfractures, as well as other defects. UVF inspection is conducted at night and involves shining an ultraviolet light source on the solar module and capturing images with a camera.
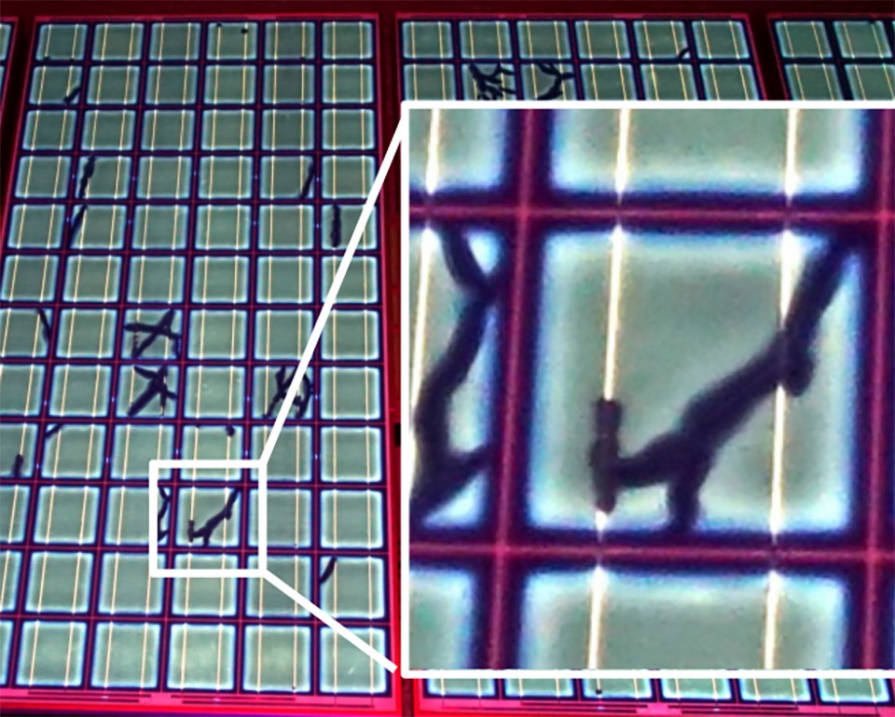
Figure 6: Example of UV Fluorescence image with microfracture example highlighted (Source: BrightSpot Automation).
Electroluminescence (EL) testing is the solar industry’s standard method for the detection of microfractures and can be performed in the field or in a laboratory setting. EL is a more expensive and time-consuming process than UVF and requires electrical connection to the module being tested. It applies reverse bias current, causing the module to luminesce. EL testing was originally designed to be performed in a controlled environment, such as a lab facility. In more recent years, advances in technology have allowed EL testing to be performed at a solar facility with the modules still installed on the racking system, thereby lowering the testing costs due to less handling. EL testing provides information regarding the type and severity of cracking and is often performed on modules selected during a UVF inspection.
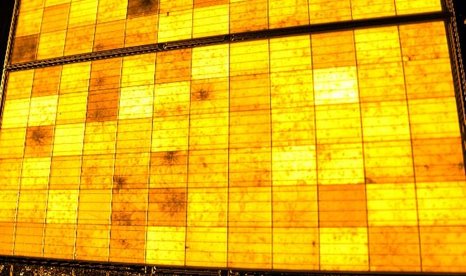
Figure 7: Example of EL Image from a hail impacted module.
Some of the common types of microfractures that are identified during EL testing are:
- Dendritic.
- Multi-Line.
- Straight Line.
Different types of microfractures can be identified through EL testing, all of which can occur for various reasons (i.e. shipping, handling, installation, etc. as outlined above). However, those most associated with hail impact damage are dendritic microfractures as highlighted below.
Figure 8: Examples of EL testing results and types of cracks.
Microfractures have the potential to create an electrical separation within solar modules, resulting in a reduction in power output to completely inactive cells; however, some modules that have microfractures can still meet the warrantied power over the module lifetime. There are multiple studies on the subject of microfractures in recent years such as an article published in August 2020, (Bdour, Dalala, Al-Addous, Radaideh, & Al-Sadi, 2020), and another study (Dhimish, 2020), where the power production observed varies greatly depending on the number of microfractures, the types of microfractures, the type of module, when the testing is conducted, and even the age of the module. Power testing like IV Curve and VOC, can be a useful tool in determining if power loss due to microcracks is beyond what is normally expected by the manufacturers over the life of the modules.
Microfractures can be difficult to associate with a specific event (hail or otherwise); however, utilizing the above-mentioned testing applications can provide useful insights into identifying a causal link. In the example of hail, by taking the test results of modules within an impacted area and comparing to test results of baseline modules (same module type, of similar age and exposure to the elements) and identifying variances in the testing can provide useful insights into microfractures likely caused by a hail event and potential damages from the same.
Best Practices After a Hail Event
Even if a more durable module option is selected, and a tracking system is in place with hail stow available, a site may unfortunately experience a catastrophic hail event with large 2+ inch hail. After a large hail event occurs, these are some good practices for evaluating your site and determining the level of damages that have occurred:
- Determine how much of the site was impacted with aerial and ground inspections.
- While aerial imagery from drones has been found to be helpful in establishing broad perimeters and efficiently captures large hail impacts, we have found it does not adequately capture small edge cracks, chips, and line cracks.
- Ground inspections are essential in establishing a true take-off of visible damages – row by row (and even module by module) assessment may be necessary to determine quantities impacted.
- Besides modules, check to determine whether anything else was impacted, i.e., tracking system components, meteorological (met) stations and sensors, buildings, substation, civil.
- If the site has a tracking system, at what angle were the modules stowed at the time of the event? Did hail stow or wind stow activate?
- Testing.
- If EL testing and/or IV Curve/VOC testing is selected to determine damage, it is important to:
- Establish a baseline assessment in an area that is “undamaged” by the reported event.
- Gather a statistically significant sample size from areas inside the damage boundaries. Not every module needs to be tested to be confident in the results found, but testing sections with different levels of damage is important.
- Determine what size hail was reported at the site.
- Gather data from local weather stations, met stations, and first-hand knowledge from Operations & Maintenance (O&M) crews, including date, time, and the direction storm approached from.
- After the storm, take pictures of hail splatter marks from strategic locations across the site with measurements of size present (heavy areas, moderate areas, lightly impacted areas).
Conclusion
Even with the best technology, modules, tracking system, software, and weather data, hail claims will continue to occur. New technologies are being developed, but the installation of solar in hail prone regions is far outpacing the technological advances to prevent large hail claims from happening. Ultimately, the decision to build a solar site in a high risk, hail prone area requires diligence in pre-construction risk assessment of modules, tracking system software, and historical weather data to provide the best information for mitigating potential losses—and engaging with professional renewable energy and weather consultants can help developers make informed risk decisions and investigate a loss after it happens.
Acknowledgments
We would like to thank our colleagues Heidi Aragon and Daniel Schreiber for providing insights and expertise that greatly assisted this research.
