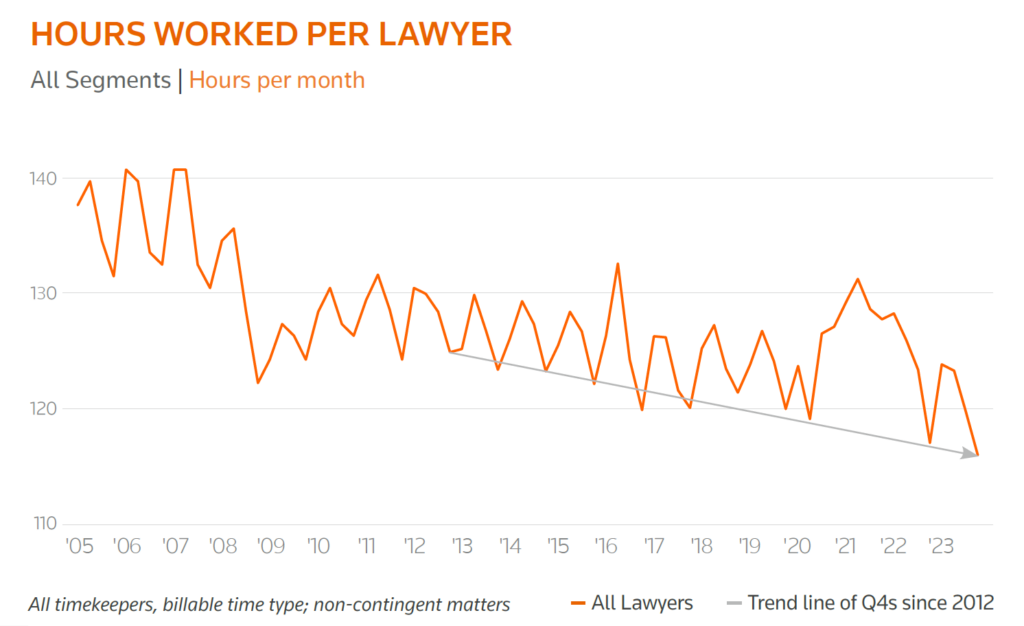
Do you want to see something scary? Borderline terrifying? Foreshadowing of major, inevitable changes in the practice and business of law? Take a look at this horror-show of a chart from the Thomson Reuters Institute & Financial Insights Law Firm Financial Index Q4 2023 Executive Report issued February 12, 2024.
Hypothetically, if I were a wealthy investor looking for a great industry to park some serious cash in (and I was not blocked by regulations governing the ownership of law firms), would I look at this industry…wherein the value of services is still determined largely by rates X time and the average productivity on the “time” side of the equation looks like a downhill ski slope? Of course not, yet we continue to encourage young lawyers to invest their future earning potential, personal reputation, and career development time in this same industry.
By most macro-level measures (e.g., total revenue; profits per equity partner), the industry is doing quite fine. However, when we drill deeper into the underlying fundamentals, we can see this established trend that is simply unsustainable, long term. I have 100% faith that the industry will adjust and continue to prosper. Adjusting requires acknowledging and addressing key challenges, which is my goal here.
After my last blog on the decline of productivity in the legal industry, I was trying to find some longer-term trend data on the issue and the good folks at Peer Monitor independently published this. While thankful the moment I saw it, my attitude changed quickly once I studied the data and started to draw conclusions.
First, let’s acknowledge and get past some of the fundamental data questions, such as:
- Is this data set representative of an entire industry? I can’t speak to the representative value because I don’t know exactly who is enrolled but I know many firms that are. Of equal importance is the fact that there aren’t many (any?) sources that have access to reliable, consistently mapped, regularly downloaded data (more than annually) from a sufficiently large and fairly static group of law firms across many years. The Peer Monitor program is a great source of real-time information (and I’m not affiliated with them and will receive nothing in return for that statement).
- Why the spikes in the data? One can clearly see the seasonality of production in this data set, with each year starting slowly, spiking in Q2, slowing in Q3 for vacations, and bottoming out in Q4 while we focus on year-end activities and multiple holidays.
- Are we to conclude that work ethic is declining across the board? That’s what this chart clearly says…right? That conclusion would be over-reaching. The reality is far more complex, and if any work ethic decline is happening then we, as an industry, are letting it happen, per my last blog.
- Is this a “Covid thing”? It can’t be. Look at the x-axis. This trend predates the Great Recession!
- Within this metric, is this largely a numerator issue or a denominator issue?
- The denominator – lawyer count – is straightforward. Unless there is wide-spread over-hiring (to offset turnover, as an example), this half of the equation is stable and generally understood.
- The numerator – billable hours – is simply “demand” as measured via the billable hours booked by this cohort of law firms across time. This is where most of the action is because there are myriad factors driving demand. For example, there’s no way to determine how much time has been shifted in-house, replaced by systems, processes, or vendors/ALSPs already. We also cannot tell if some aspects of demand are truly declining or disappearing entirely. There is also no way to determine how much work is being shifted into contingency or fixed fee models or the degree to which hours are being under-reported or written-off to balance the demands of clients against internal reporting and compensation expectations. There are so many questions and hypotheses that we could develop but we do know, with certainty, that these are the hours used for billing purposes to determine the vast majority of fees billed and collected by these law firms…and that’s what really matters under the current service valuation model.
- How, then, are lawyers continuing to make very fine incomes, given that the basis for the valuation of legal services is still largely based on hours X rates? Billing rate increases to a VERY large degree. That’s it.
When I started in law firm consulting in the late 80s (not a typo), there was already much talk and writing of “death of the billable hour.” I bought into it. How could rate increases go on forever? The model had to collapse at some point…right? It seemed obvious, yet it hasn’t happened yet, even after more than three decades (for me). During that time, however, I never really considered the possibility that the end of the traditional billable hour model might actually come from the hours/time part of the equation. The economics of the industry distracted me from seeing this, even though I know that any Associate billing fewer than 2,000 hours back in the 80s and 90s was an outlier who could expect an unpleasant visit from someone in management to discuss such a concerning situation. The same applied for Partners who billed fewer than 1,750 hours (while, over time, everyone speaks as if they are equally swamped and stressed).
Fortunately, the rate X hours model is still working nicely and will buy us time as we analyze this and either reverse the trend or evolve into another valuation model. I think we have some time because, in my opinion, the whole rate X hours model is, and will be, protected by the strong preference for it from clients who are, at a majority level right now, either actual Boomers or Gen-Xers who think like Boomers. Once most clients shift to younger X-ers and some Gen-Yers, these preferences and protections are likely to change.
We have time to analyze and act, with key steps being:
- Keep pushing on rates. It’s our key to success right now. If you cannot get your Partners to move or want some new ideas on this topic, download a complimentary Law Firm Pricing Toolkit from our Partner Mark Medice (mmedice@lawvision.com) and then schedule a complimentary 2024 rate plan review with him.
- Calculate this Hours per Lawyer metric for your firm at the firmwide and major practice levels. Then, dig much deeper into the influences – most likely on the numerators – to really understand the underlying storyline(s), which makes them actionable. Set measurable improvement goals and get to work.
- Take whatever the next step is in the evolution of Individual performance management at your firm. Still at an educational level? Great – work on that program. Ready to start developing profitability data? Great – agree on philosophies and how the data will be used first. Ready to set performance standards? Great – if you can enforce them too. Always know your next step and please keep moving forward with haste.
I appreciate the Peer Monitor program taking this shot across the bow of the industry. It certainly caught my attention. Now, we can all see it and there’s time to evaluate, adjust, re-evaluate, learn and adjust some more. After all, how high can rates go??
