Introduction
Frequently, I am asked by clients to predict how long it will take for FDA to review and clear a 510(k). At a high level, I observe that on average clearance can take 160 days according to the data. Then, beyond that, I observe that review times are highly variable among differing product codes, and the very first Unpacking Averages post I wrote in October 2021 provided a graphic to show just how much variation there was depending on the technology. Here, though, I want to dive into yet another separate factor that should be taken into account, the seasonality of FDA decision-making.
Your first reaction might be, what are you talking about? Doesn’t the FDA work at the same pace all year long? The short but maybe surprising answer is, no, they don’t. The FDA is an organization of humans, and seasonal changes such as major holidays and other factors impact FDA’s progress in conducting reviews. In this post, I’ll try to quantify those seasonal variations.
Results
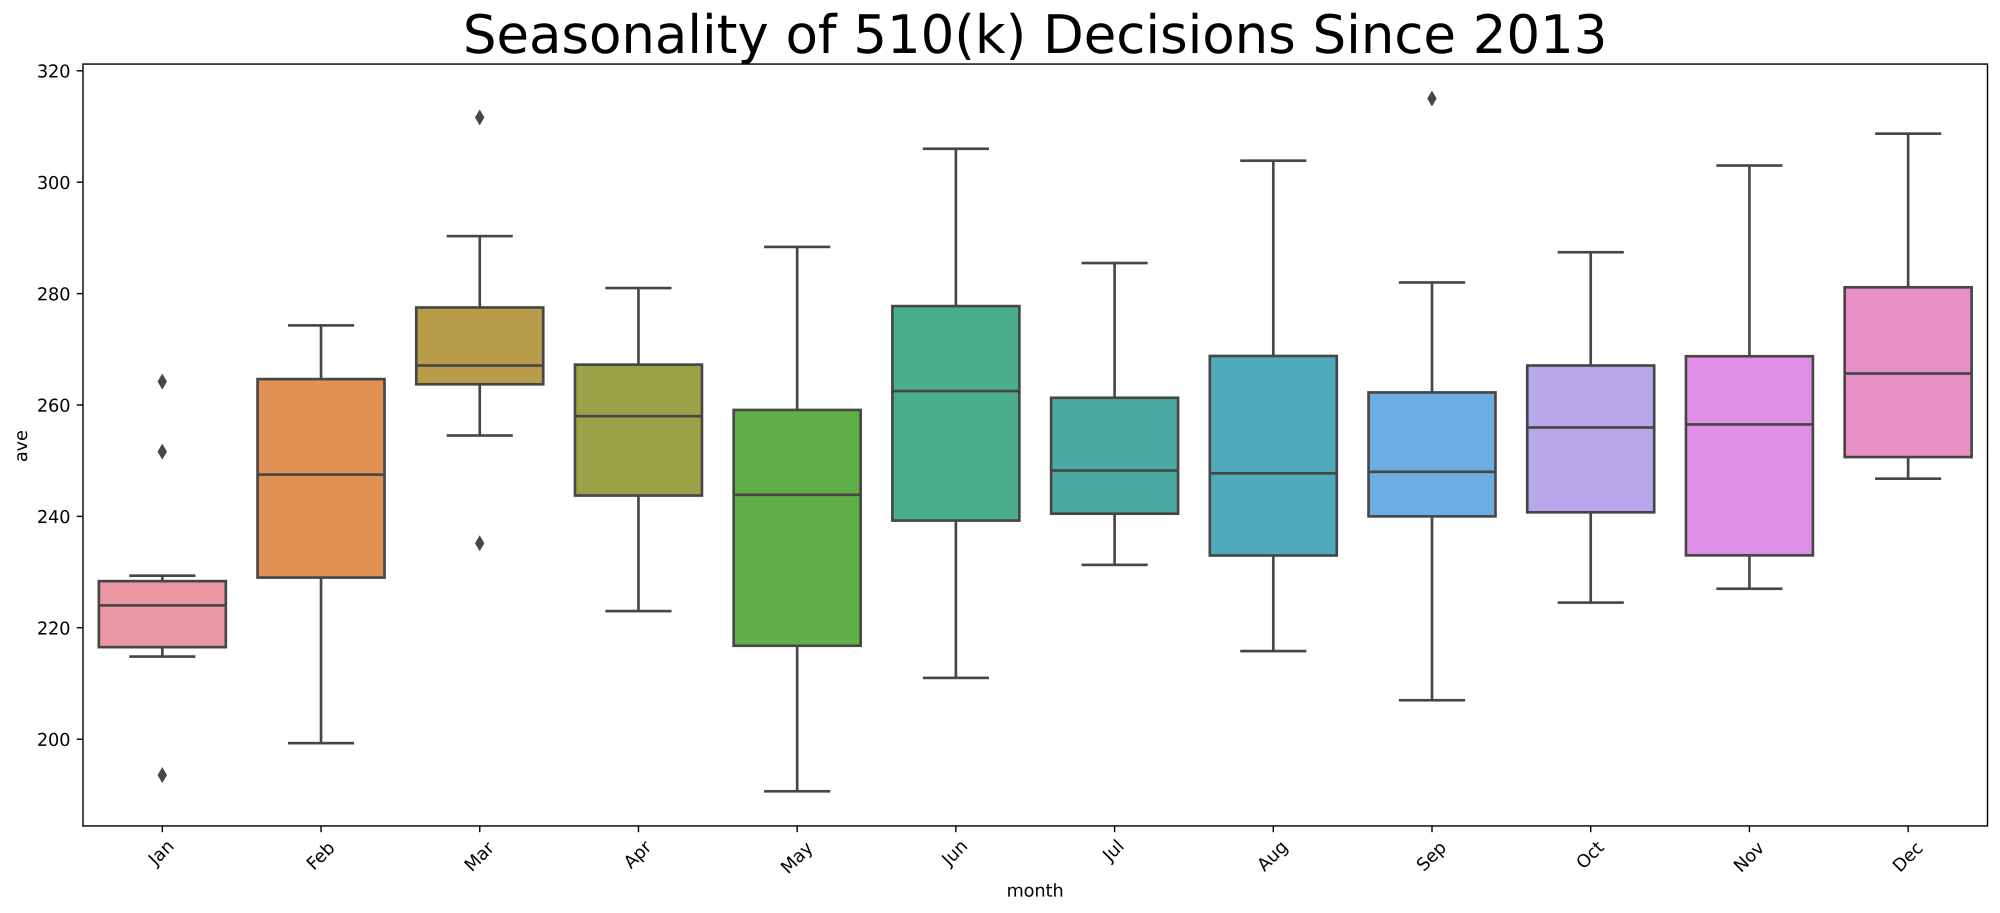
I chose to highlight seasonal variation by month because it shows the signal of seasonal variation without the noise of daily or weekly variations. Further, I chose to use box plots to display the data covering the ten fiscal years 2014 through 2023 inclusive. I’ll remind you below exactly how to interpret a box plot.
Your immediate question might be, is the seasonality the result of FDA actions, or is it that the segment of industry most likely to file a 510(k)s is itself seasonal, such that it explains the decision-making variation. To address this question, I will provide you with the seasonality of 510(k) filing decisions over the same time period.
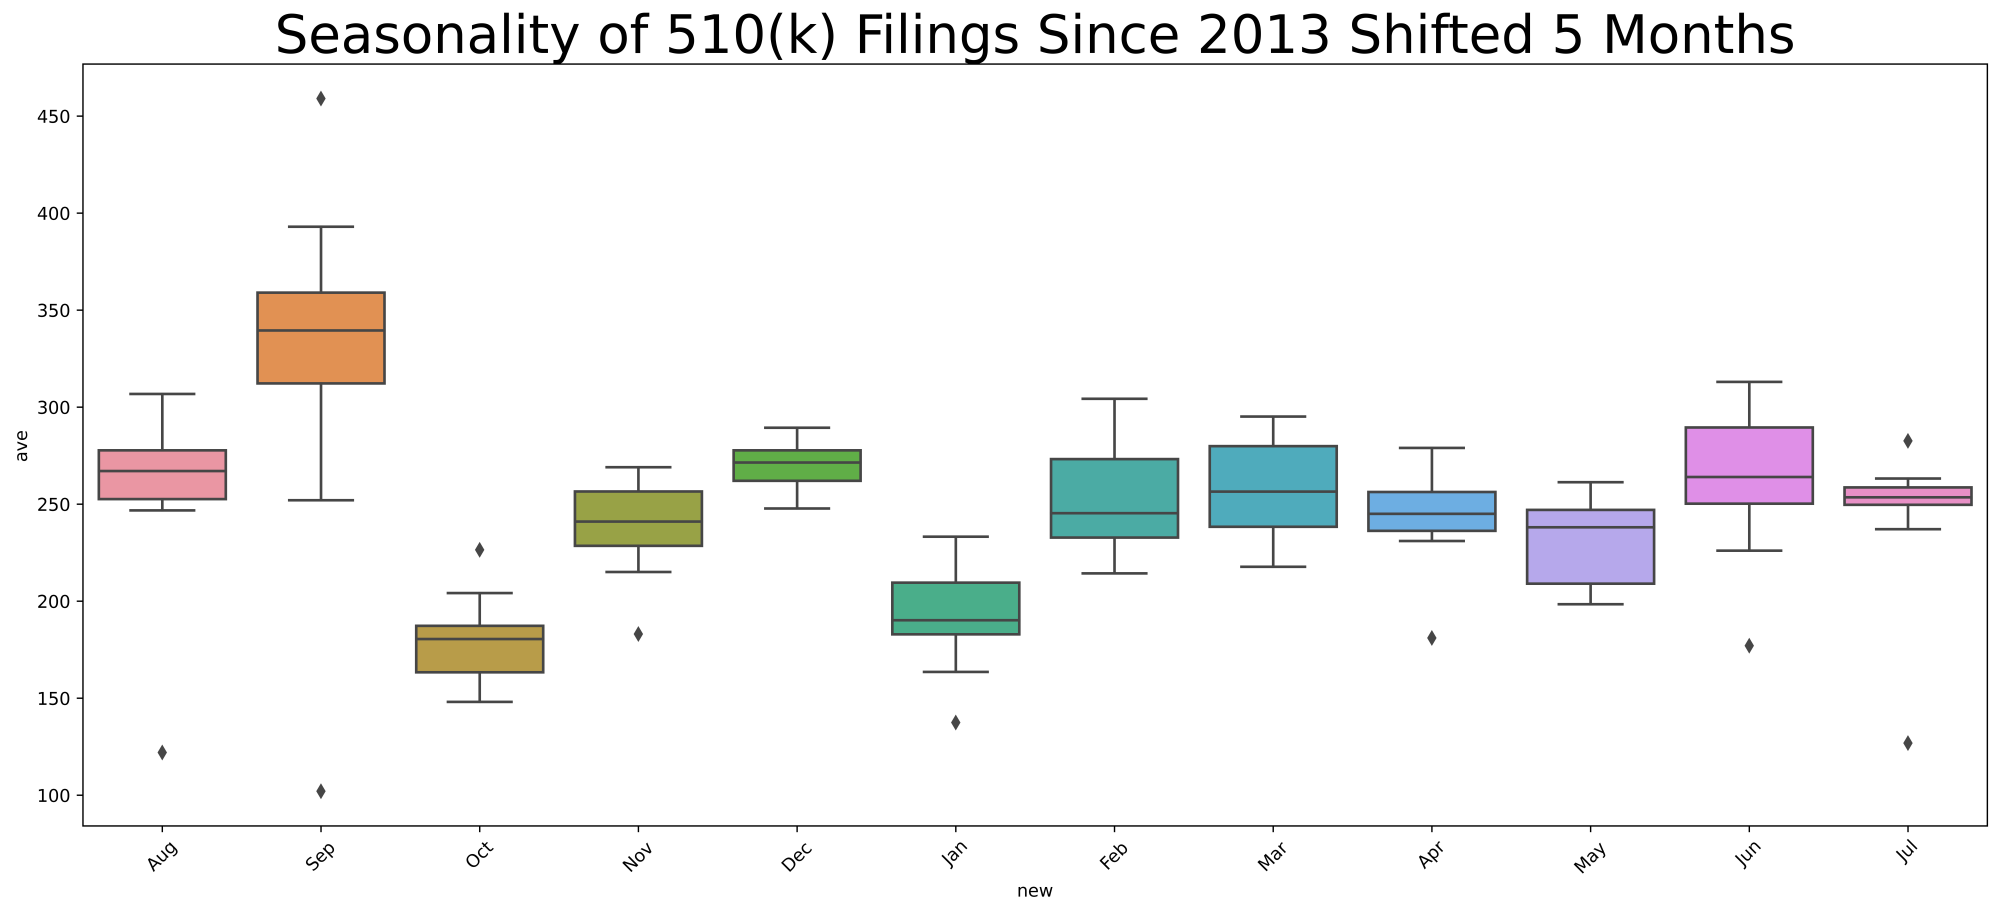
If you look at the x-axis, you will notice that in the second chart I begin with August. I shifted the calendar by five months because it takes on average just over 160 days during this 10-year time period for FDA to make a decision, so you would think that what happens in the filings 160 days prior is most relevant to explaining the pace of decision-making. 160 days translates to about 5 1/3 months, so obviously it’s not a perfect alignment.
Methodology
I started by calculating the total number of 510(k) decisions each calendar month for the 10 fiscal years. Obviously, months vary in length from 28 days to 31 days, and I didn’t want that variation influencing the output, so I divided the total each month by the number of days in the month to achieve a daily average for that month, and then I multiplied that daily average by 30 to make the numbers look like monthly totals.
Box plots are basically just a nice way to show the variability of data and key benchmarks. To remind you, if you don’t use box plots every day, the line in the very center of the box is the 50th percentile. Each of these box plots represents 10 data points, specifically the 10 monthly averages over the 10 fiscal years. Thus, the central horizontal line in the box is the 50th percentile or median of those 10 years.
The bottom and the top of the box itself correspond to the 25th percentile and the 75th percentile. As a result, the box itself would include the middle 50% of the data or the interquartile range. The horizontal lines connected above the box and below the box represent the maximum (calculated as the third quartile + 1.5 times the interquartile range) and minimum values (calculated as the first quartile -1.5 times the interquartile range) and they are connected by vertical lines to the box called whiskers (I have no idea who came up with that name). If one or more of the values is a statistical outlier, that outlier is depicted by a diamond above or below the box plot.
Interpretation
Big picture, the first thing that strikes me in these box plots is that industry is much more predictable than FDA. Look at the relatively small variation each month measured by the height of the box. The industry filing boxes are fairly short, compared to the FDA decision-making boxes that are vertically taller.
But, there is some seasonality in both filings and FDA decision-making. Both go up and down, although I would argue that February through August is remarkably consistent in industry submissions.
Now let’s go from left to right.
January
Overall, FDA decisions are pretty consistent according to the January data, in the sense that the box is not very tall, although three out of the ten data points are outliers. The decisions in January are comparatively fewer in number than the rest of the year. But if we look at the filings in August of the prior year, while January produces typically a few more than 220 decisions, August contributes typically 270 filings. So, for some reason other than filings, January is a down month for FDA 510(k) decision-making. I won’t make a joke about holiday hangover, but obviously the start of the month typically includes The University of Michigan playing for the national championship in college football. Sorry. Just had to insert that. But some factor other than the number of filings is keeping FDA decision-making down in January.
February
This is a decidedly better month where the FDA decision-making grows on average by over 20 510(k) decisions, but February is also highly variable month both in the interquartile range and measured by minimum versus maximum. To some extent it seems to be explained by a surge in industry filings in September, although I would note that there are almost 350 filings versus 250 decisions.
March
FDA seems to get caught up in March. The decisions go over 260, while October industry filings fall to about 180. Apparently not many people at FDA take spring break in March.
April
This month seems to be almost steady state, with just fewer than 260 decisions and just fewer than 250 filings in the prior November. Consequently, FDA continues to make a bit ground in April.
May
May is an incredibly variable month for FDA decision-making and I don’t honestly know why. Variability means that there’s a lack of consistency, so I wouldn’t expect to be able to explain it through some reference to Memorial Day or something that occurs every year. Over the 10 years, I’m not able to think of anything that happens on and off in May to explain the high variability.
It certainly can’t be explained by the variability in December filings. December filings has next to the least variability of any month other than July. So, it’s a mystery to me why FDA decision-making is so highly variable in May. But FDA, on average, seems to be in steady state with about 260 submissions filed in December and on average about 250 decisions made in May.
June
The variability of FDA decision-making continues into June, but with a higher average. Again, it can’t be explained by variability in the filings, as January tends to be pretty consistent with regard to industry activity. I would note there is a dip in filings in January with an average fewer than 200, but FDA seems to get caught up a bit in June with an average slightly over 260 decisions. The industry filings don’t surprise me. There’s typically a huge push at companies to get filings done before Christmas, and then January falls off.
July through December
The second half of the year is less seasonal, more consistent, than the first half of the year. The month-to-month variability is reasonably the same, and the average rate of FDA decision-making is mostly the same but gradually ramps up toward the end of the calendar year.
Industry filings are likewise pretty consistent from February through August as already noted. This may well produce the stable progress of FDA decision-making.
I have to say that if you asked me to predict these charts before I looked at the data, I would’ve guessed that September would be one of the strongest months for FDA decision-making as the agency perhaps pushed to make decisions before the end of the fiscal year to get its numbers up. My guess shows how little I know. The months of July, August, and September are remarkably consistent, and then FDA decision-making actually picks up in October and stays steady through the end of the calendar year, or the first quarter of the fiscal year for the government. Made me look kinda stupid.
Conclusions
FDA decision-making is seasonal, at least in the first half of the calendar year. Obviously, I would just be speculating if I tried to identify causes for that seasonality. I’m sure managers at FDA have a better sense of what might cause it. There may, for example, be some seasonality in the hiring of new reviewers. Obviously if they hire many fresh graduates, that would occur in the summer, but typically FDA reviewers are not fresh college graduates. But employee turnover might very well be seasonal in some way. The seasonality of vacations also would likely have some sort of an impact, although I really don’t see much impact specifically from the major holidays.
There’s no big profound message here, just the observation that even things like government decision-making have their seasons, and it’s good to keep that maybe in the back of your mind if you’re really trying to get a 510(k) through as quickly as possible. It seems like the idea of getting a submission on file in January might be a good strategy to take advantage of the high rate of decision-making in June. But obviously it would be foolish to finish a 510(k) in December and then wait until January to file it to take advantage of this effect. There’s never a benefit to waiting unless all you care about is duration, and not timeliness. You will likely always get a decision soon – even if the review time is longer – if you file earlier.
The Unpacking Averages™ blog series digs into FDA’s data on the regulation of medical products, going deeper than the published averages.
[View source.]
